This function plots simple and complex pedigrees, with options specific to
the types of pedigrees used for quantitative genetic inference in natural
populations. This function is flexible to missing parents and can be
customized to visualise specific cohorts, sexes, and/or phenotype
availability. Pedigree layout is optimized using a Sugiyama algorithm. For
simpler pedigrees, visualisation may be improved by specifying
spread_x_coordinates = FALSE.
Usage
ggpedigree(
  .data,
  ids,
  mothers,
  fathers,
  cohort,
  sex,
  pheno,
  sex_code = NULL,
  id_labels = FALSE,
  remove_singletons = TRUE,
  plot_unknown_cohort = FALSE,
  spread_x_coordinates = TRUE,
  print_cohort_labels = TRUE,
  return_plot_tables = FALSE,
  line_col_mother = "#E41A1C",
  line_col_father = "#377EB8",
  line_col_no_pheno = "#aaaaaa",
  line_alpha = 0.3,
  point_size = 1,
  point_colour = "black",
  point_alpha = 1
)
Arguments
- .data
a data frame object with all the pedigree information
- ids
a column of .data of individual identifiers
- mothers
A column of .data of mothers corresponding to ids. Missing values are 0 or NA.
- fathers
A column of .data of fathers corresponding to ids. Missing values are 0 or NA.
- cohort
integer. Default NULL. A optional column of .data assigning a cohort to each id. If NULL, then
kinship2::kindepthis used to assign cohorts to ids.- sex
integer or character. Default NULL. An optional column of .data assigning a sex to each id. When using this option,
sex_codemust be specified. Any values not matching values insex_codewill be treated as unknown sex.- pheno
integer or character. Default NULL. An optional column of .data assigning a phenotype to each id. Links originating from parents that have
NAvalues for this argument will be plotted with a grey line, unless otherwise specified inline_col_no_pheno.- sex_code
Default NULL. A vector of length 2, indicating the value used in
sexfor females and males respectively. Females are plotted as circles, males as squares, and unknown values as triangles.- id_labels
logical. Default FALSE. Print the ids on the pedigree plot.
- remove_singletons
logical. Default TRUE. Remove ids with no relatives i.e., no offspring or parents assigned.
- plot_unknown_cohort
logical. Default FALSE. Plots ids of unknown cohorts. These are plotted in an "Unknown" cohort at the top of the pedigree. Be aware that any mothers and fathers of these individuals will be plotted below them.
- spread_x_coordinates
logical. Default TRUE. Evenly spreads the x-axis (horizontal) distribution of points within each cohort. If FALSE, this will plot the direct outcome of
igraph::layout_with_sugiyama; the FALSE option is only recommended for small pedigrees and/or less connected pedigrees.- print_cohort_labels
logical. Default TRUE. Prints cohort levels on the left hand side of plot.
- return_plot_tables
logical. Default FALSE. Returns an object with the line and point data used for the plot, but the plot will not be generated
- line_col_mother
Default = "#E41A1C". Line colour for maternal links.
- line_col_father
Default = "#377EB8". Line colour for paternal links.
- line_col_no_pheno
Default = "#aaaaaa". Line colour for parents with
NAvalues inpheno.- line_alpha
Default = 0.3. Line alpha (transparency) value for maternal and paternal links.
- point_size
Default = 1. Point size for ids.
- point_colour
Default = "black". Point colour for ids.
- point_alpha
Default = 1. Point alpha for ids.
Examples
data(gryphons)
pedigree <- fix_ped(gryphons[, 1:3])

## draw the gryphon pedigree by pedigree depth
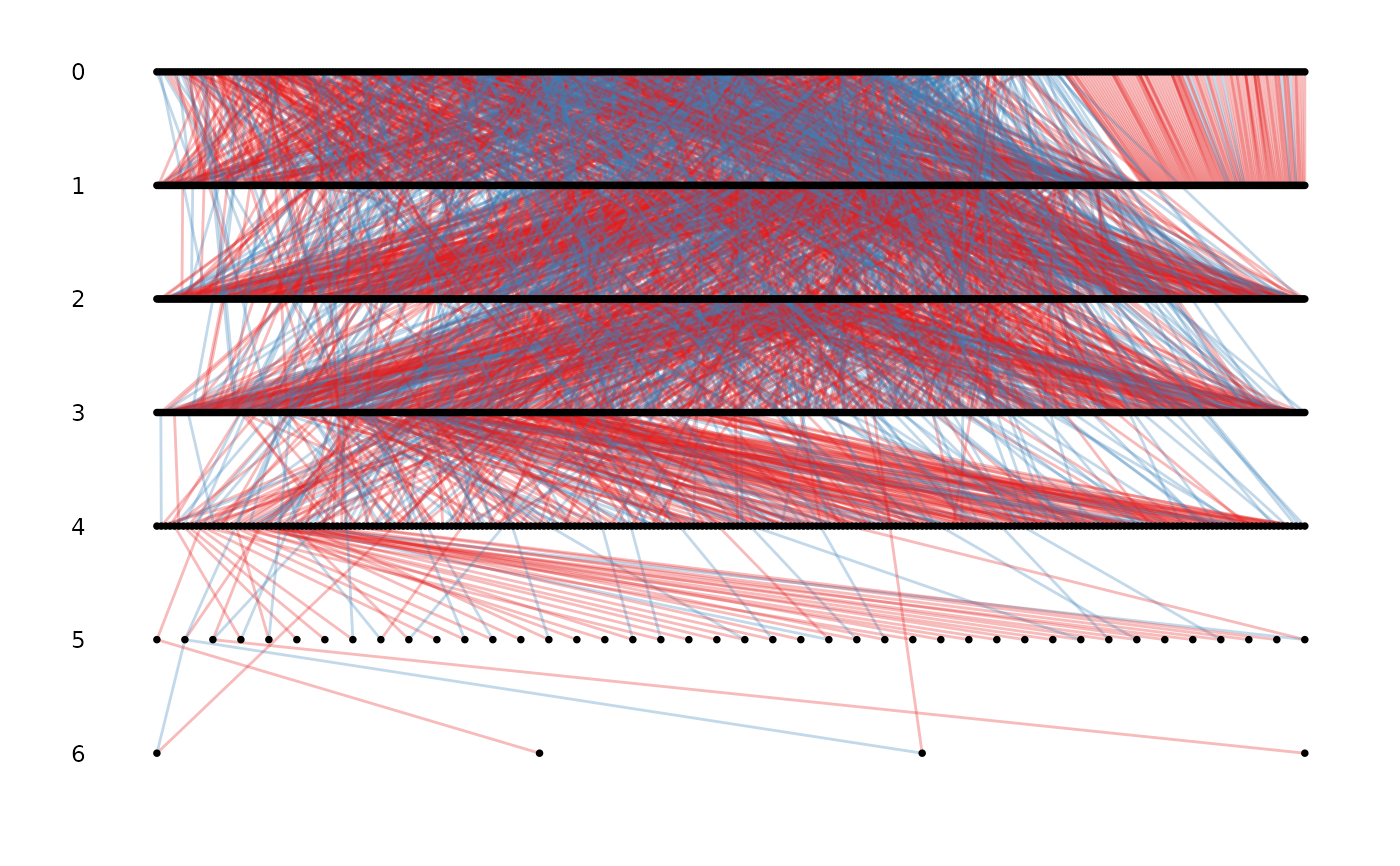
ggpedigree(pedigree)
#> Warning: the first 3 columns were used for id, dam and sire identity, please specify if not correct or to remove the warning


# \donttest{
# specifying the column names for id, mother and father
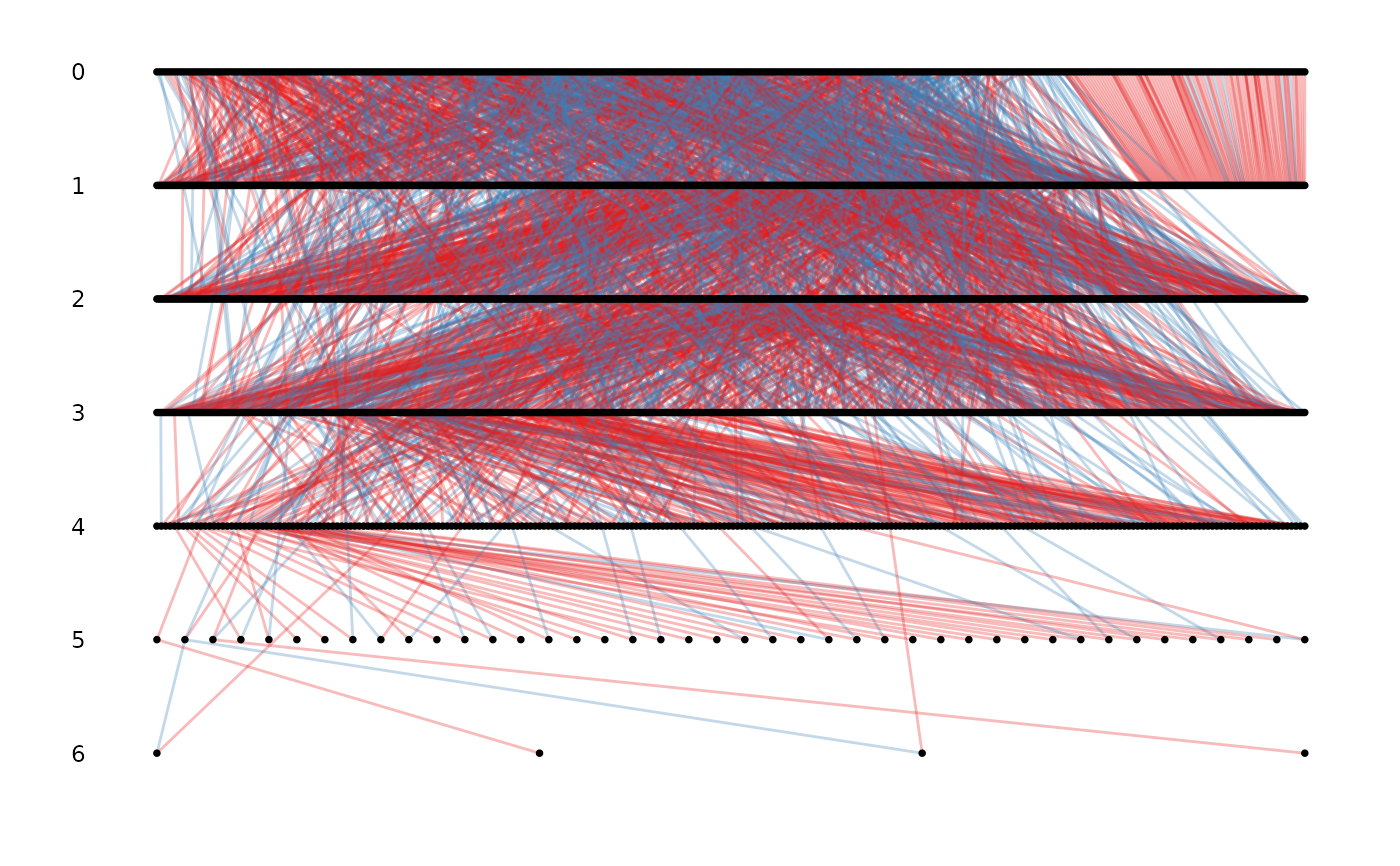
ggpedigree(pedigree, id, dam, sire)


# with cohort and sex
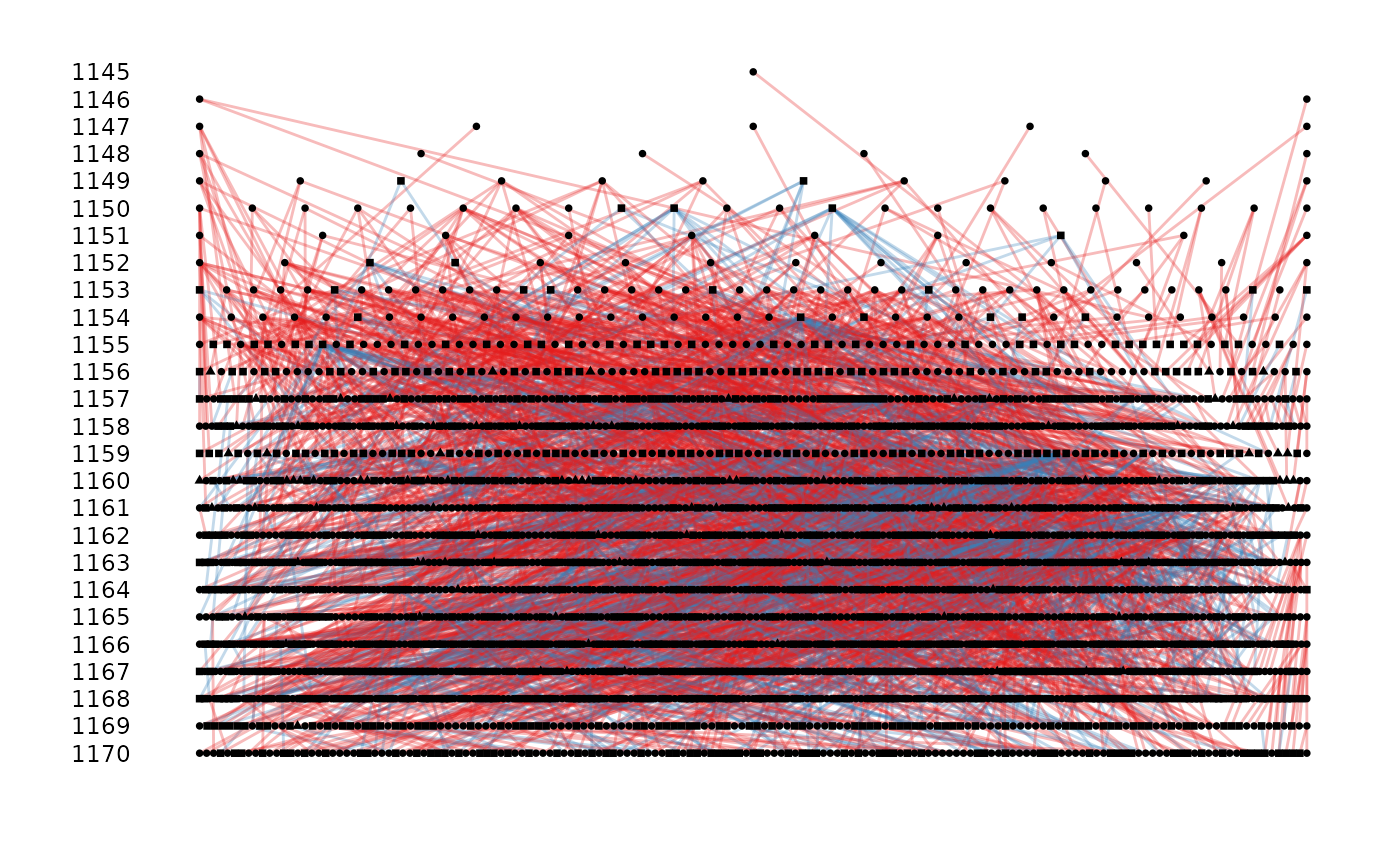
ggpedigree(gryphons, cohort = cohort, sex = sex, sex_code = c(1, 0))
#> Warning: the first 3 columns were used for id, dam and sire identity, please specify if not correct or to remove the warning


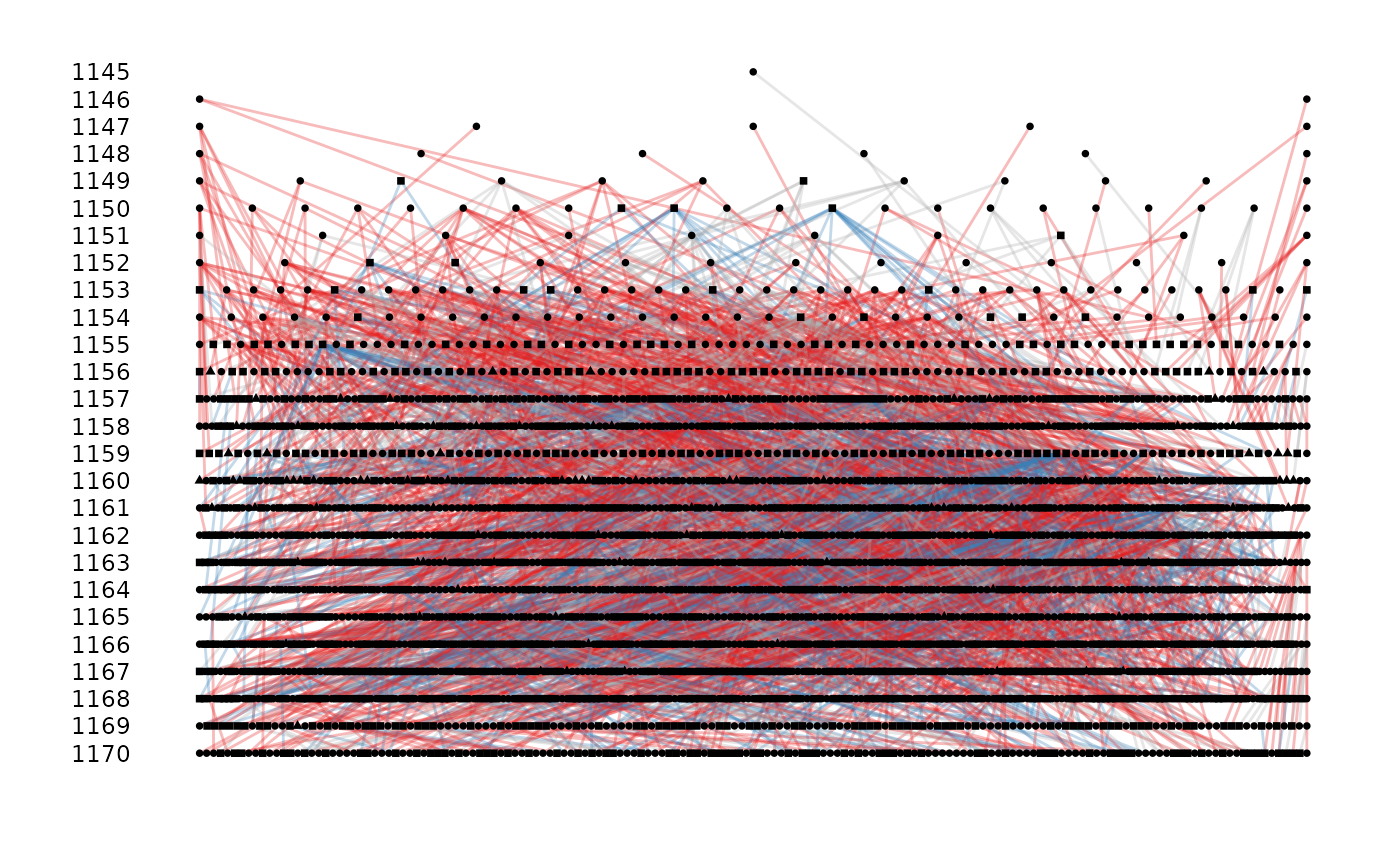
#' with cohort, sex, and pheno
gryphons$pheno <- 1
gryphons$pheno[sample(length(gryphons$pheno), 1000)] <- NA
ggpedigree(gryphons, cohort = cohort, sex = sex, sex_code = c(1, 0), pheno = pheno)
#> Warning: the first 3 columns were used for id, dam and sire identity, please specify if not correct or to remove the warning

# }
# }