Produce a graphical representation of the relatedness matrix of a pedigree
Source:R/draw_pedA.R
draw_pedA.RdCreates the object needed to plot a pedigree's numerator relatedness matrix given a few different choices for ordering. The resulting image for a pedigree of size n can be visualized as a n x n grid of colored squares based on values of the numerator relatedness matrix.
Usage
draw_pedA(
  pedigree,
  order = c("original", "generation", "user"),
  grp = NULL,
  ...
)
Arguments
- pedigree
A data.frame of a pedigree with 3 columns: id, dam, sire
- order
A character expression for how the pedigree should be ordered for visualization. See Details.
- grp
A character expression for the column name in pedigree indicating how to order the pedigree for visualization.
- ...
Additional plotting arguments passed to
image.
Examples
data(gryphons)
pedigree <- fix_ped(gryphons[, 1:3])
## draw the gryphon pedigree
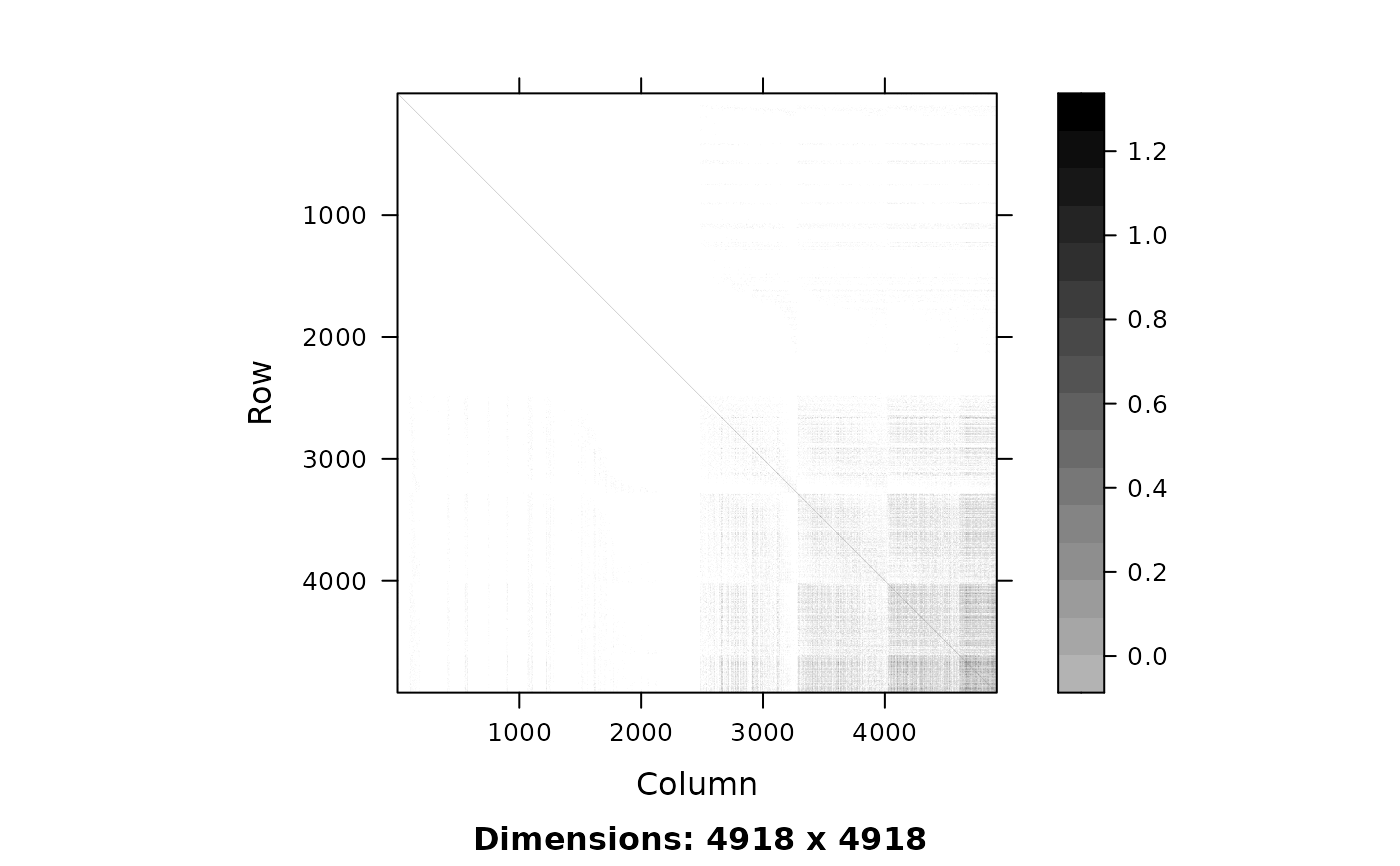
draw_pedA(pedigree, order = "original")
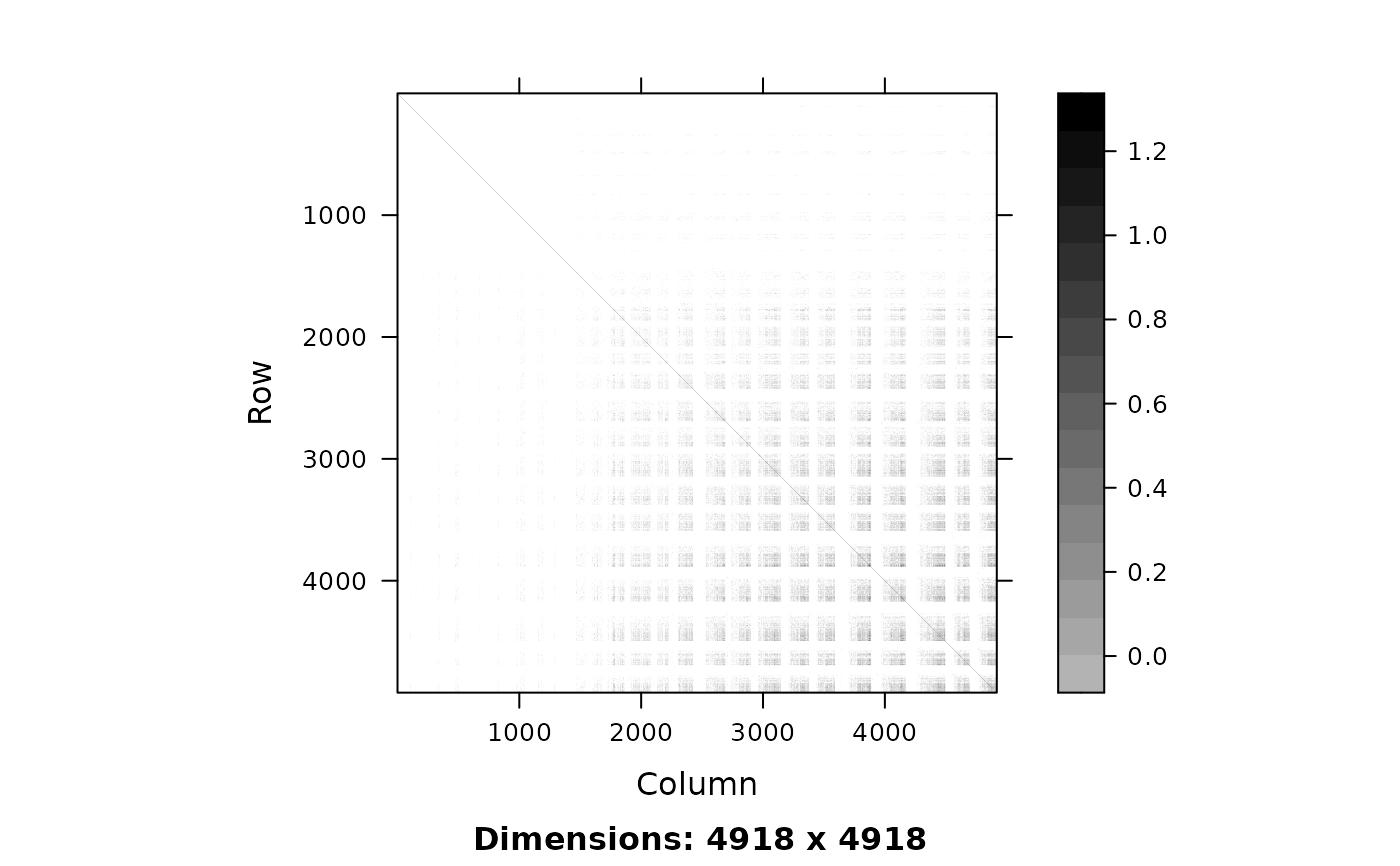
 ## draw the gryphon pedigree by function assigned generation
(Agen <- draw_pedA(pedigree, order = "generation"))
## draw the gryphon pedigree by function assigned generation
(Agen <- draw_pedA(pedigree, order = "generation"))
 # \donttest{
## draw the gryphon pedigree by cohort in the dataset
## add cohort back from original data
pedigree$cohort <- NA
pedigree$cohort[match(gryphons$id, pedigree[, 1])] <- gryphons$cohort
(Achrt <- draw_pedA(pedigree, order = "user", grp = "cohort"))
# \donttest{
## draw the gryphon pedigree by cohort in the dataset
## add cohort back from original data
pedigree$cohort <- NA
pedigree$cohort[match(gryphons$id, pedigree[, 1])] <- gryphons$cohort
(Achrt <- draw_pedA(pedigree, order = "user", grp = "cohort"))
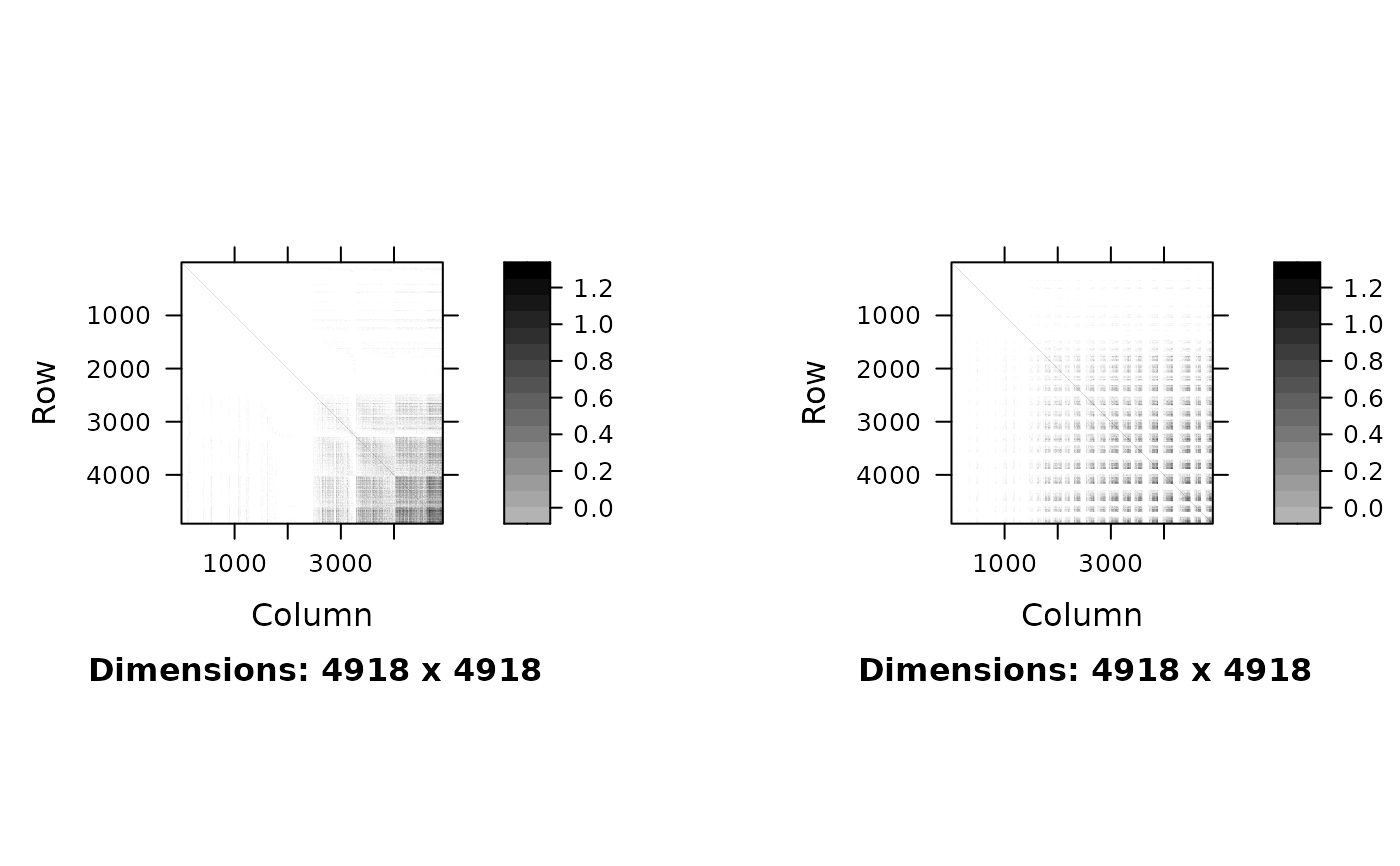
 ## show two images of the same pedigree in different orders
### (i.e., plotting multiple trellis objects in the same figure)
plot(Agen,
position = c(xmin = 0, ymin = 0, xmax = 0.45, ymax = 1),
more = TRUE
)
plot(Achrt, position = c(xmin = 0.55, ymin = 0, xmax = 1, ymax = 1))
## show two images of the same pedigree in different orders
### (i.e., plotting multiple trellis objects in the same figure)
plot(Agen,
position = c(xmin = 0, ymin = 0, xmax = 0.45, ymax = 1),
more = TRUE
)
plot(Achrt, position = c(xmin = 0.55, ymin = 0, xmax = 1, ymax = 1))
 # }
# }